About Me

I am a data science professional interested in utilizing data to solve social, economic, and environmental dilemmas. I have a background in geosciences, human geography, and urban planning, where I have learned to solve many spatial analytical problems. I have developed a variety of programming skills, GIS skills, and remote sensing skills suitable to a large variety of industries. I can be of great help in various fields, including machine learning, web development, GIS, environmental science, and city planning.
View My LinkedIn Profile
View My Resume
Email : kyle.p.mccarthy97@gmail.com
Kyle McCarthy’s Portfolio
Data Visualization and Web Development
Urban Forestry Modelling
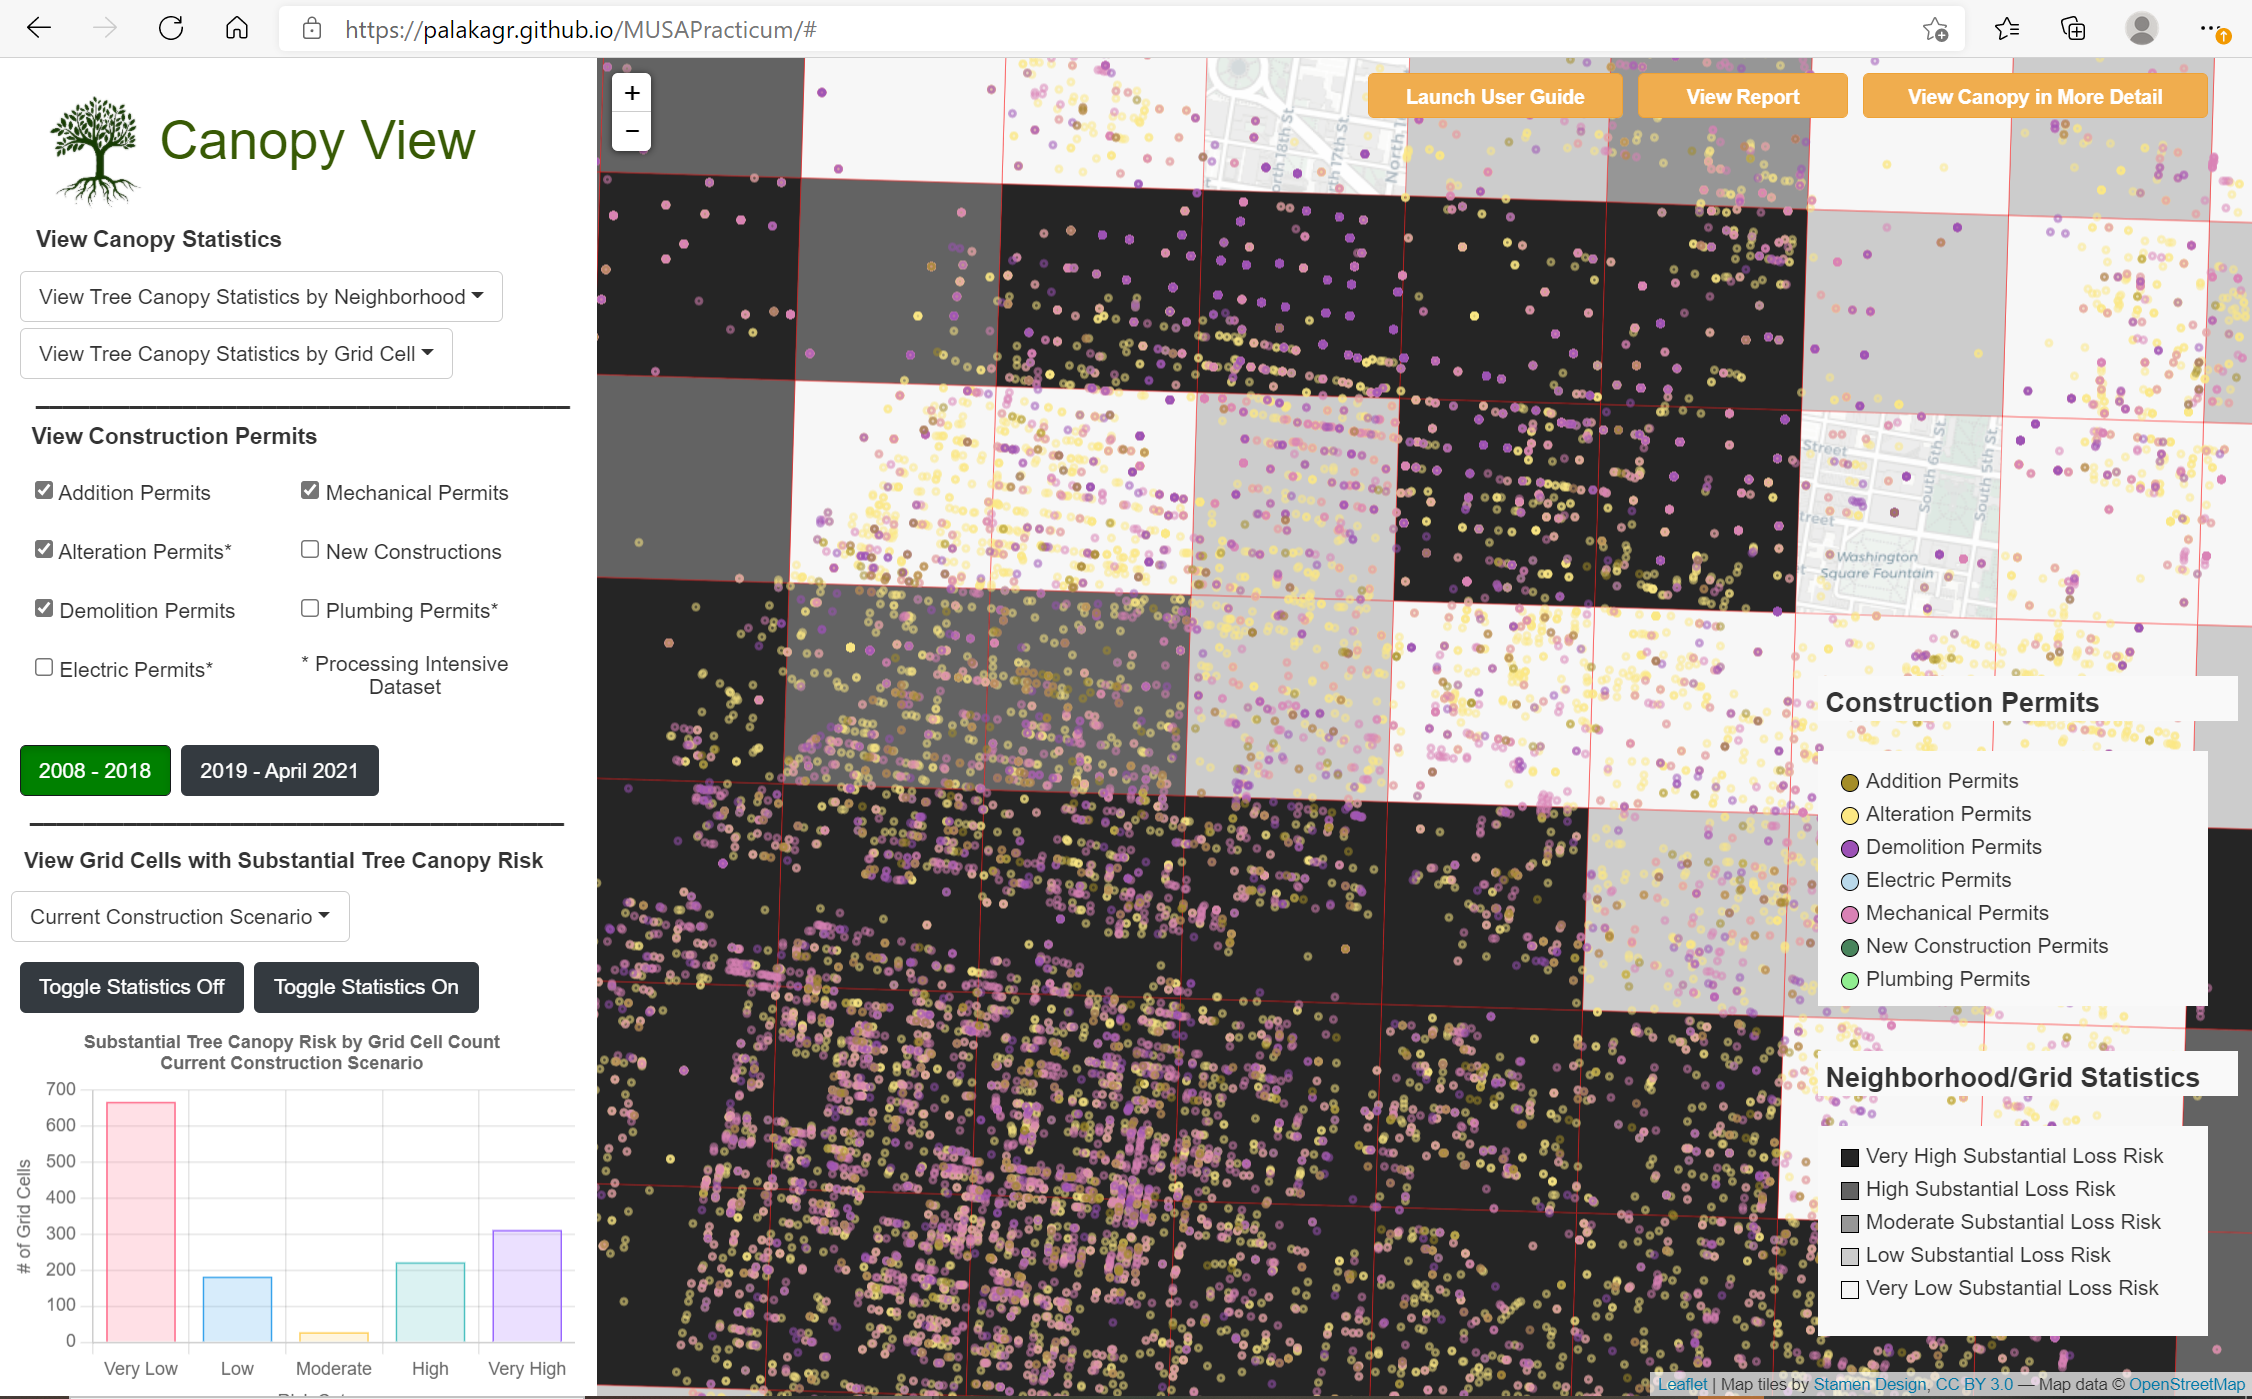
- Most of Philadelphia tree canopy loss occurs in historically disenfranchised communities. In response, the City of Philadelphia has set essential milestones for conserving and increasing the current tree canopy in the city. In this analysis, we model tree canopy loss in Philadelphia and identify risk factors. We additionally assess the city’s progress on the goals and how this varies across neighborhoods. The model predicts where substantial tree canopy loss in Philadelphia is most likely to occur. By predicting substantial tree canopy risk, we hope that the model can serve as a tool for local environmental non-profits and government agencies to prioritize their urban greening initiatives. We created a user-friendly web application to communicate the results. The web application has three distinct features. First, the application allows you to view the current state of the tree canopy in Philadelphia. Second, the application allows users to view where construction permits locate. Third, most importantly, the application allows users to view areas that are at high risk for substantial tree canopy loss.
Urban Forest Web Application, Pennsylvania - Leaflet, JavaScript, CSS, HTML, JQuerry
San Diego Earthquake Prediction Web Application
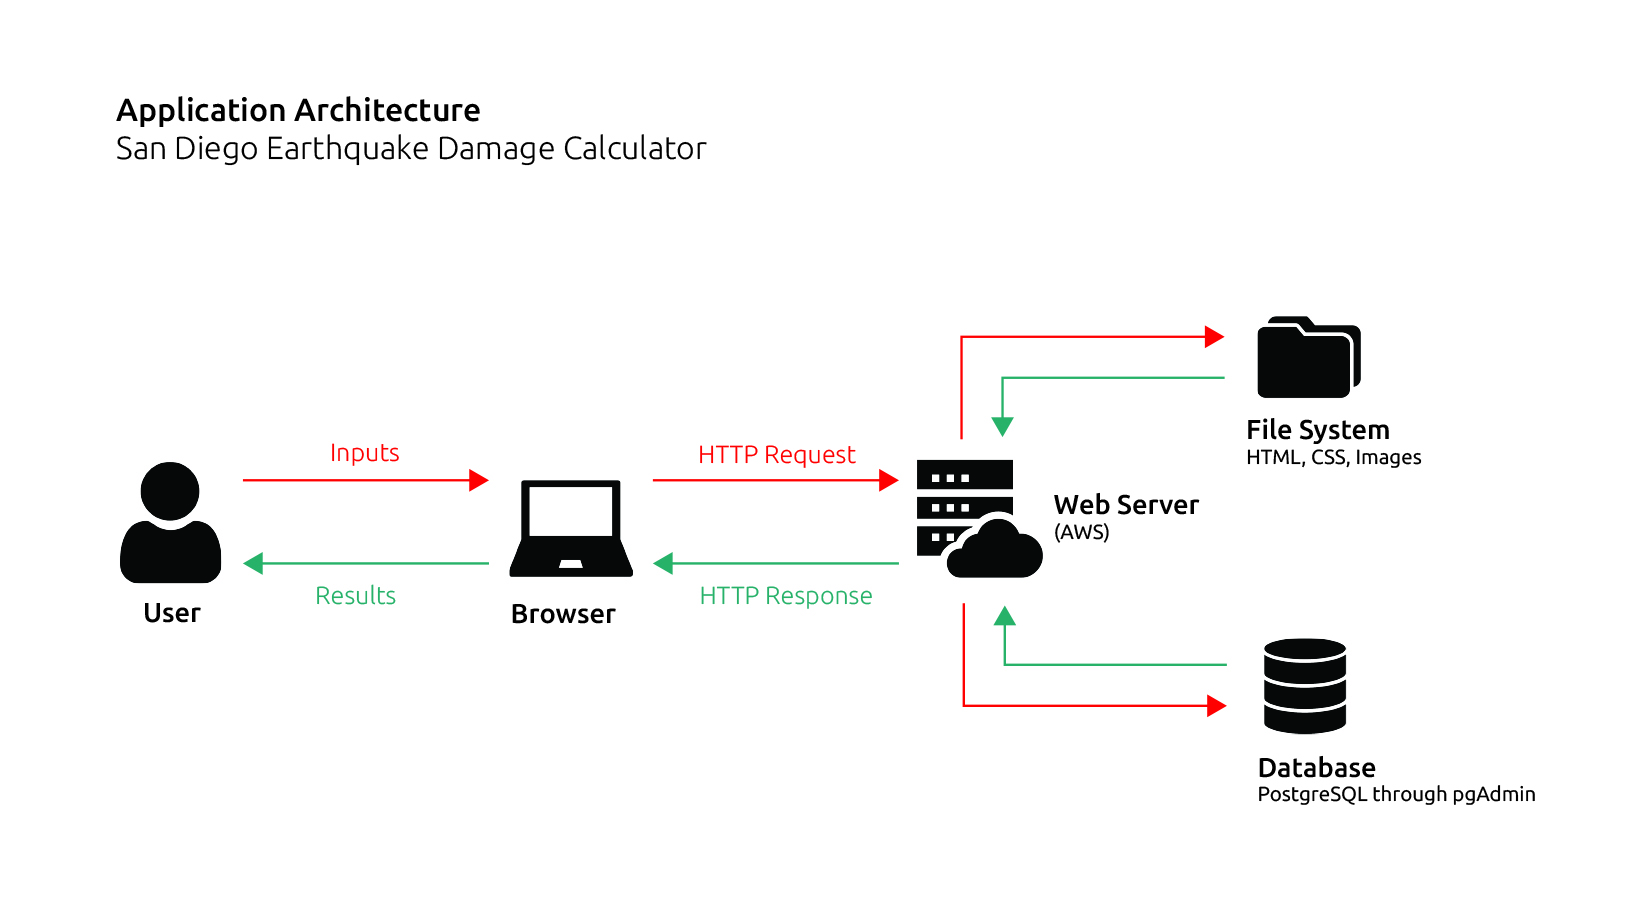
- According to the California Geologic Survey, San Diego is vulnerable for a potential 6.9 earthquake. Below is the github repo for a future preparedness earthquake application. The user selects a zip code for a future potential earthquake epicenter. Based on the epicenter, the app predicts the damage cost in each zip code. The user can select a zip code to view all public buildings, their current condition, and overall cost. Based on these values, we develop a metric to determine building damage while highlighting which buildings should be repaired to withstand an earthquake. Unfortunately, the website is no longer available due to having been hosted on AWS through a class. However, the Github Source code is available for viewing below.
Geospatial Modelling
Vermont Car Crash Trauma Center Analysis
- Often times the distance from a trauma center to a hospital determines if a car crash victim survives. In Vermont, there are only two trauma centers meaning that much of the state is at a higher risk for car crash deaths. This ArcPy tool determines where a new hospital is best located, specifically looking at where car crash risk is the highest along with underserved regions within the state.
Vermont Car Crash - Trauma Ceneter Analysis- ArcPy, ArcGIS API, ArcGIS Pro

Urban Growth Modelling
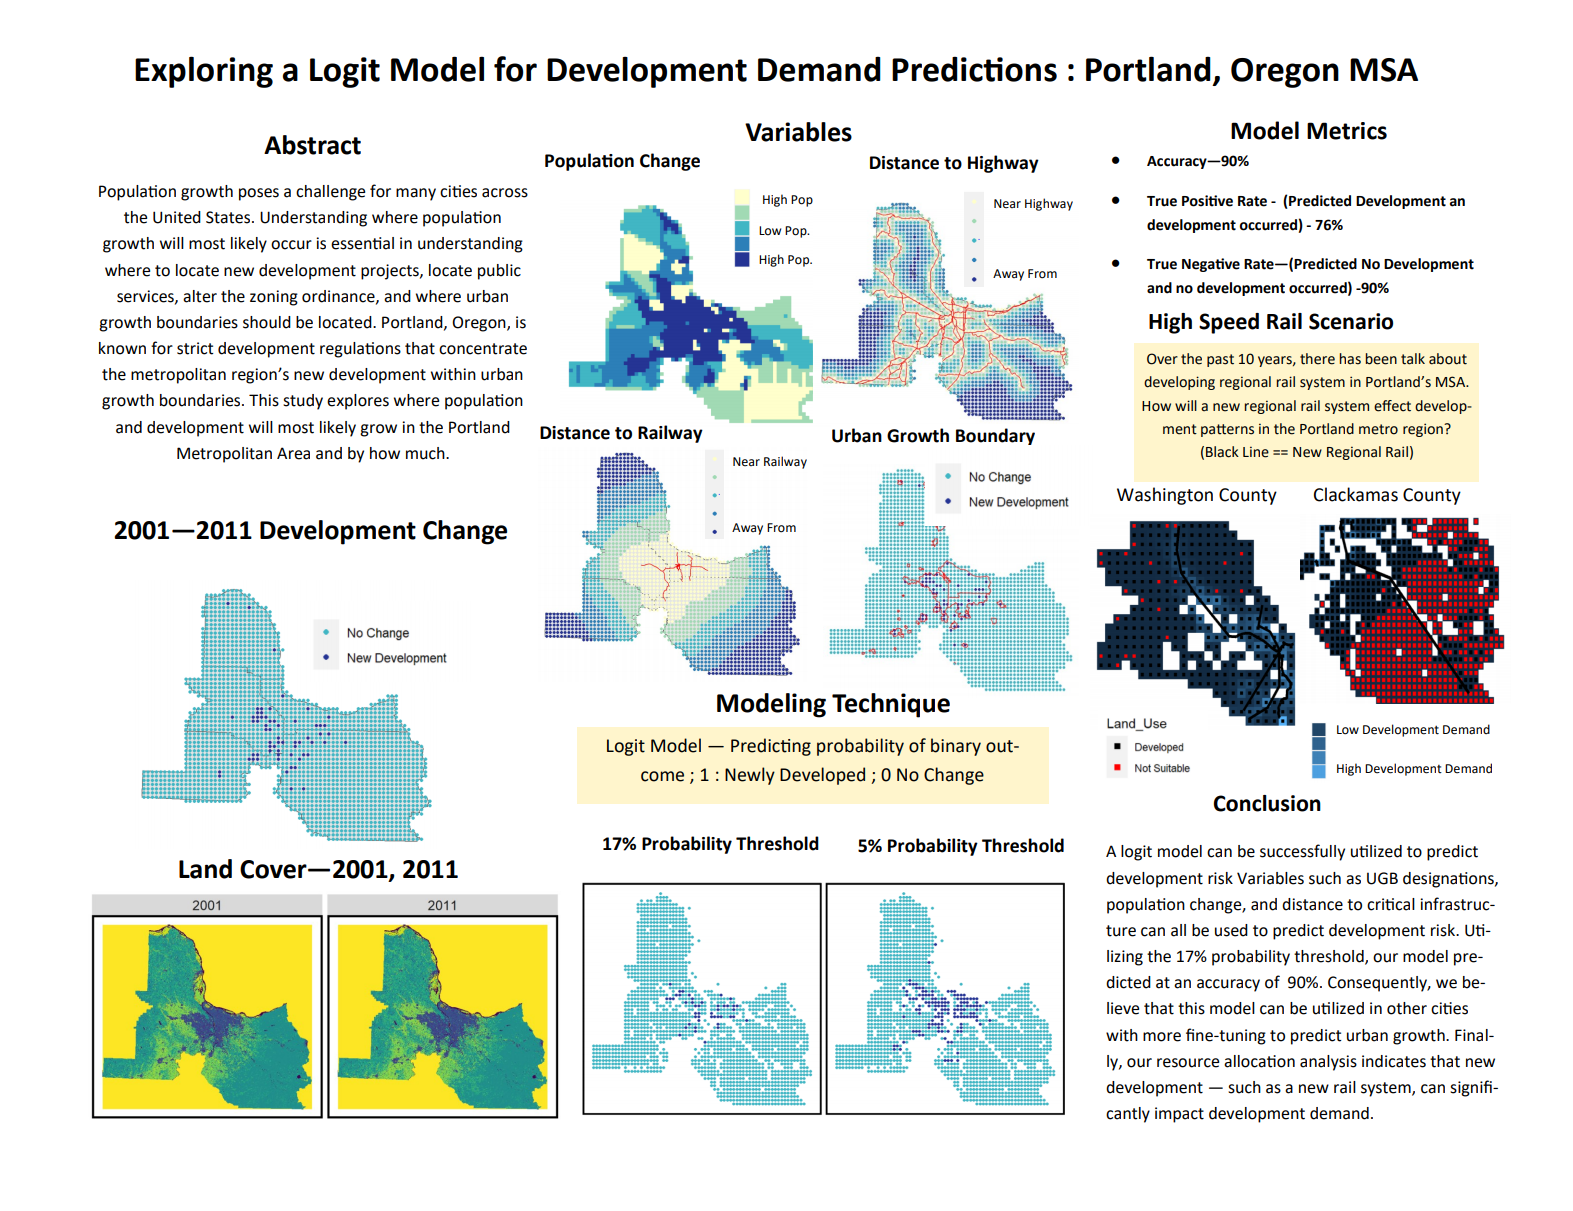
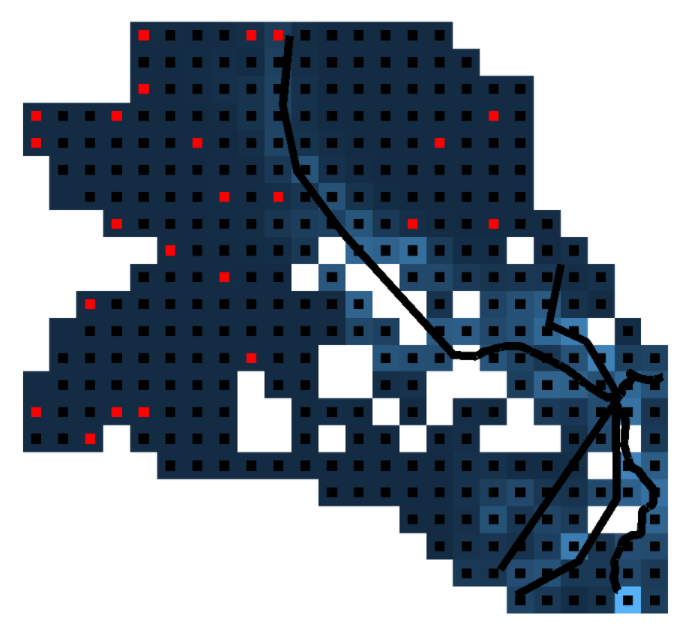
- Population growth poses a challenge for many cities across the United States. Understanding where population growth will most likely occur is essential in understanding where to locate new development projects, where to locate public services, how to alter the zoning ordinance, and where urban growth boundaries should be located. Portland, Oregon is known for strict development regulations that concentrate the metropolitan region’s new development within urban growth boundaries. Within this study Tristian Grupp and I explore where population and development will most likely grow in the Portland Metropolitan Area, and by how much.
Urban Growth Modelling Portland, Oregon - R Studio, ESRI ArcGIS, Raster
Home Tax Credit Prediction Model
- This study’s motivation is to create a model regarding whether an individual will take the credit for a home repair tax credit in Emil City. Typically only 11% of the homeowners take the credit. Recently, the department created a new marketing campaign where they now project that 25% of the homeowners take the credit. A sample of records was given, which were then feature engineered to create a more accurate model. The cost of marketing is 2850 dollars per person. However, when someone takes the credit, the department makes 5000 dollars. The community also receives a benefit from the credit. Surrounding homes gain a 56000 dollar aggregate premium, while houses that take the credit sell with a 10000 dollar premium. This particular study creates a model to determine whether a specific individual will take the credit or not. A cost analysis of the model will also be performed, analyzing the model’s performance.
Home Tax Credit Prediction Model - R Studio (Machine Learning)
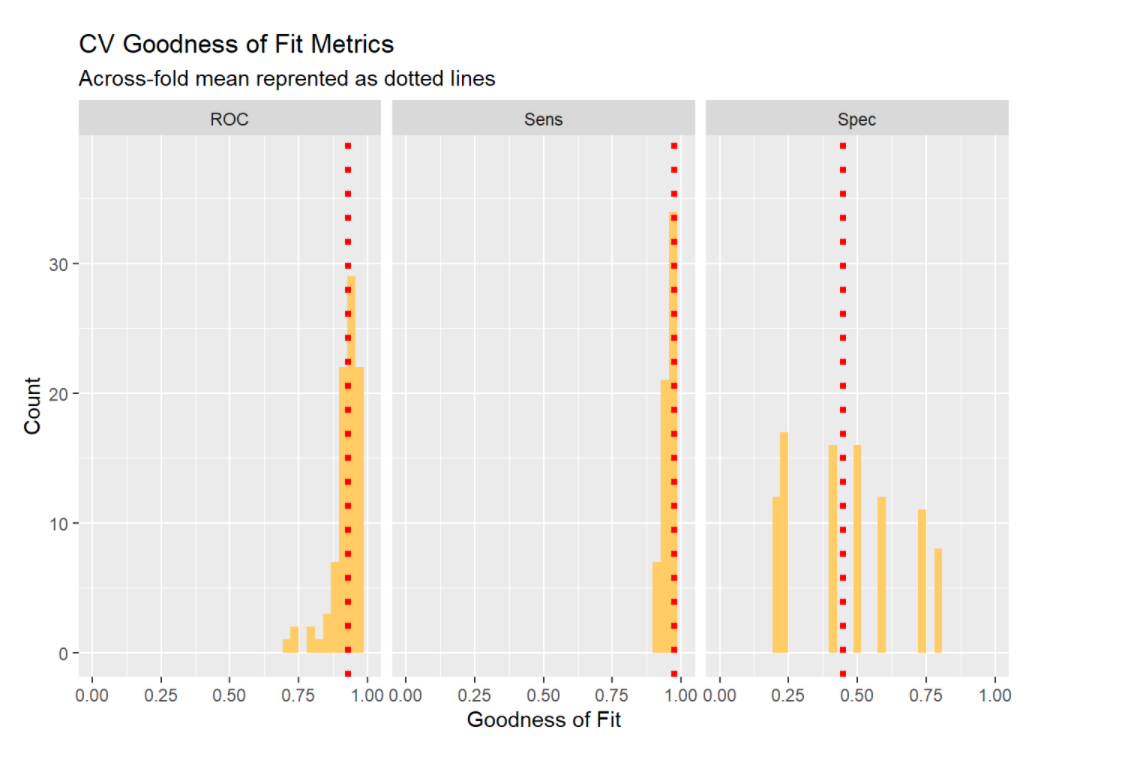
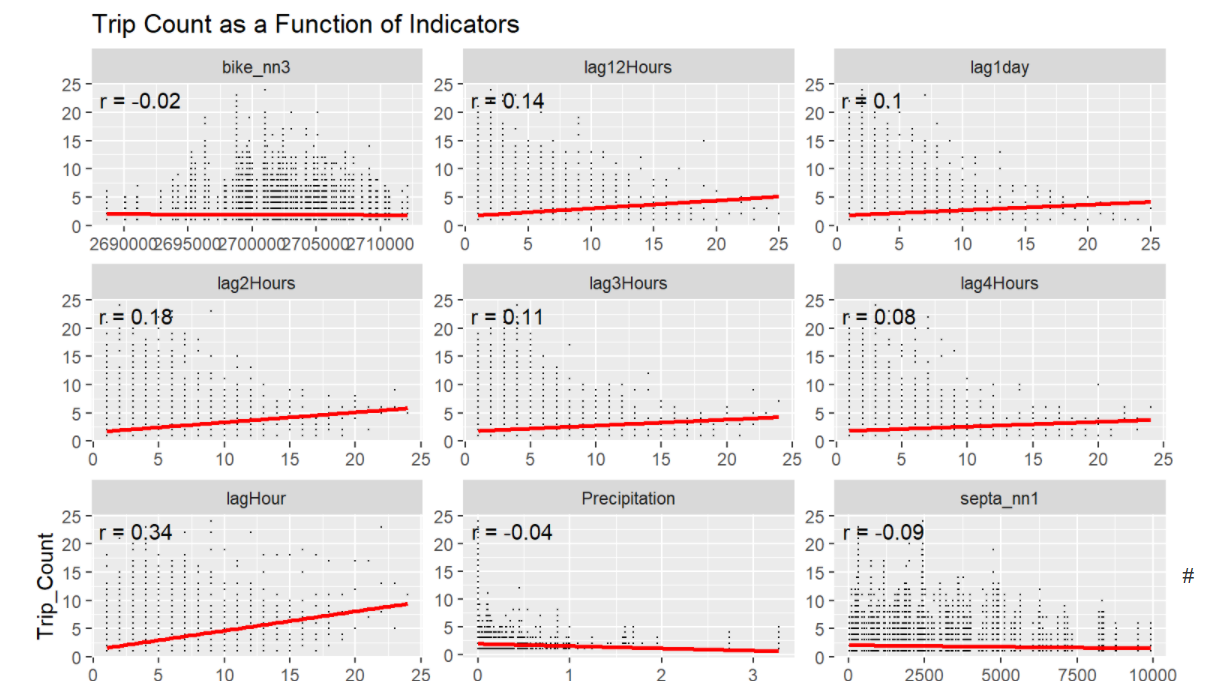
Bike Share Resource Allocation Model
- Bike share is a growing form of green transportation across the United States and the world. For Indego bike-share in Philadelphia to maximize bike share usage across the city, they must account for balancing. This particular algorithm accounts for spatial and temporal scales to determine when and where bikes should be allocated to maximize bike share usage in Philadelphia.
Modeling Bike Share Usage Philadelphia - R Studio (Machine Learning)
Heroin Overdose Risk Modelling
- I collaborated with Tristan Grupp in creating a machine learning model to predict heroin overdose risk in Cincinnati, Ohio. Our algorithm helps the Cincinnati City Government to determine where social services should be allocated, along with EMS services to prevent heroin overdose deaths. The data is then developed into a user friendly web application to best determine where EMS and rehabilition services should be placed.
Modeling the Heroin Overdose Crisis in Cincinnati - R Studio (Machine Learning)

Geospatial Statistics
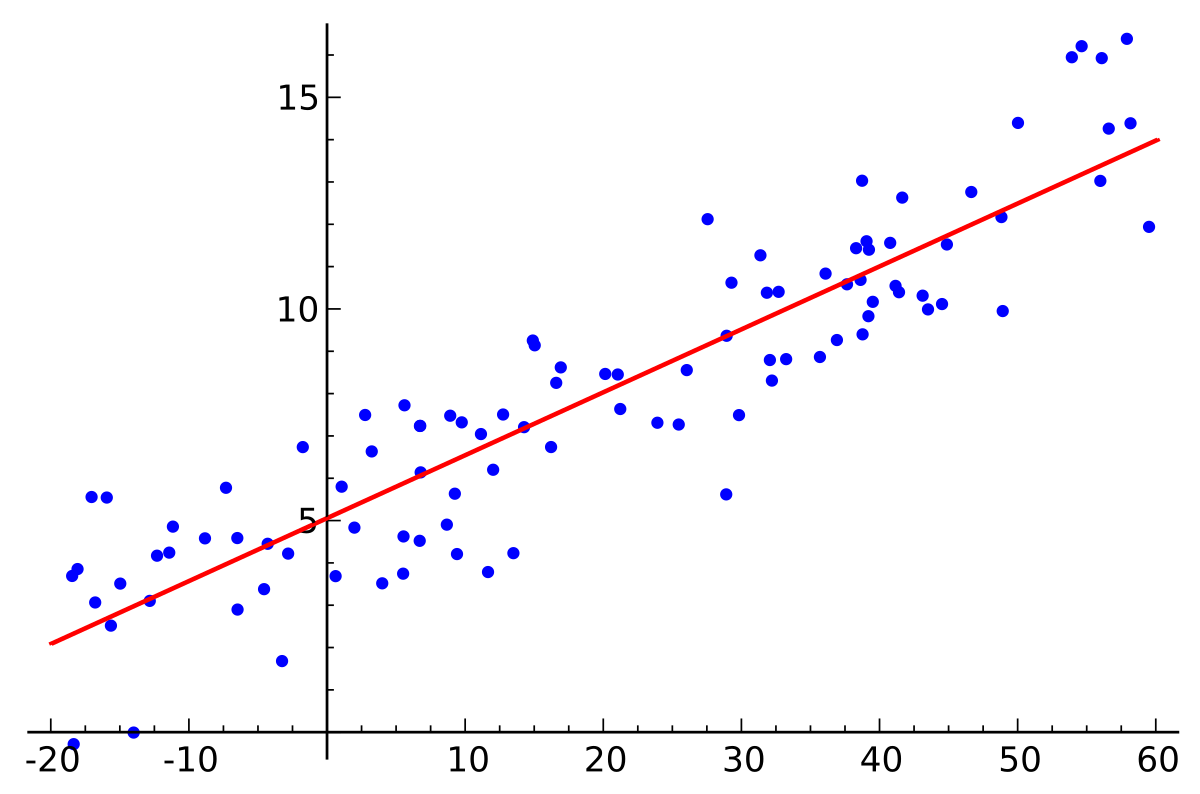
OLS Regression
- Philadelphia is a diverse city earning the title of the “city of neighborhoods.” Although neighborhood boundaries are often subjective, there are over fifty neighborhoods within the city limits. Each neighborhood has its distinct characteristics, consisting of significant differences in demographics, infrastructure, and land use. The spatial variability across the city creates a challenge for spatial modeling. Our goal is to evaluate median house values and their relationship to numerous census variables for this project utilizing OLS regression.
OLS Regression Modeling - R Studio, ArcGIS
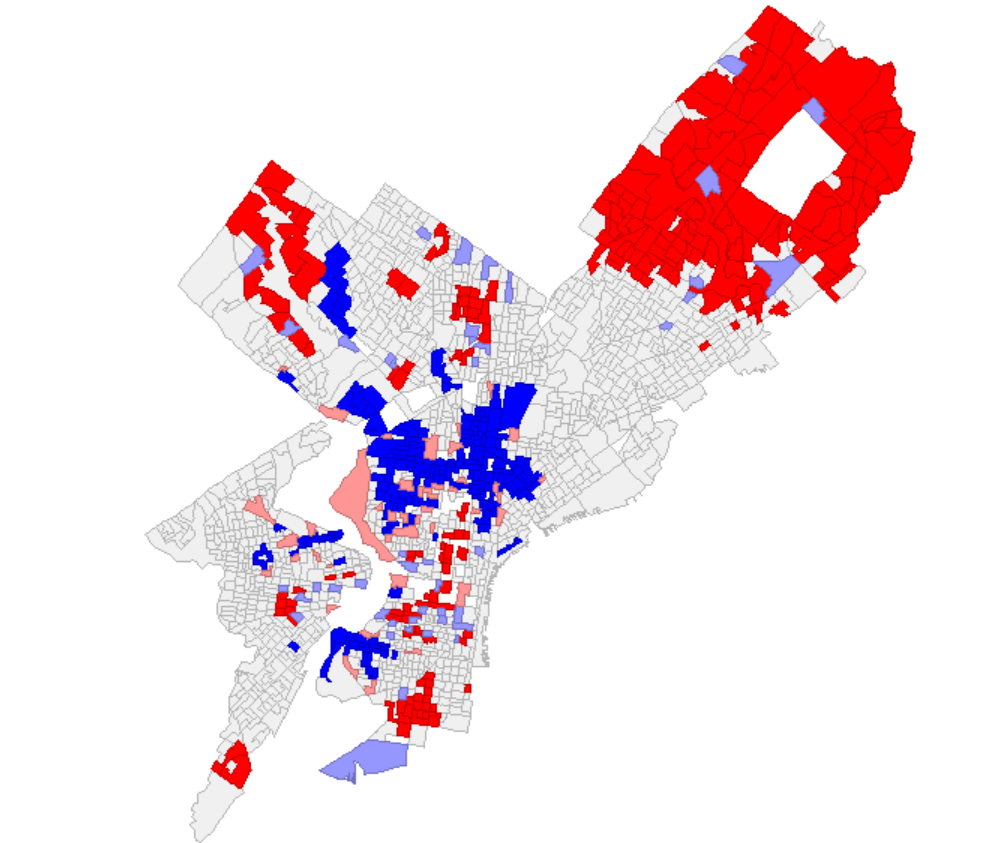
Spatial Lag, Spatial Error, Geographically Weighted Regression
- This study utilizes spatial lag, spatial error, and geographically weighted regression to account for spatial autocorrelation. The last study found that housing vacancy, college attainment, poverty status, and singly family homes were strong predictors of housing units’ median value. We found this by regressing the dependent variable median house value on the predictors housing vacancy, single-family homes, college attainment, and poverty. Although the findings were statistically significant, the method did not account for spatial autocorrelation. This report intends to account for spatial lag, spatial error, and geographically weighted regression to determine if these methods are more suited for geographic analysis than ordinary least squares regression.
Spatial Lag and Spatial Error - Geoda, ArcGis, R Studio
Writing Samples
Zoning Ordinance Analysis
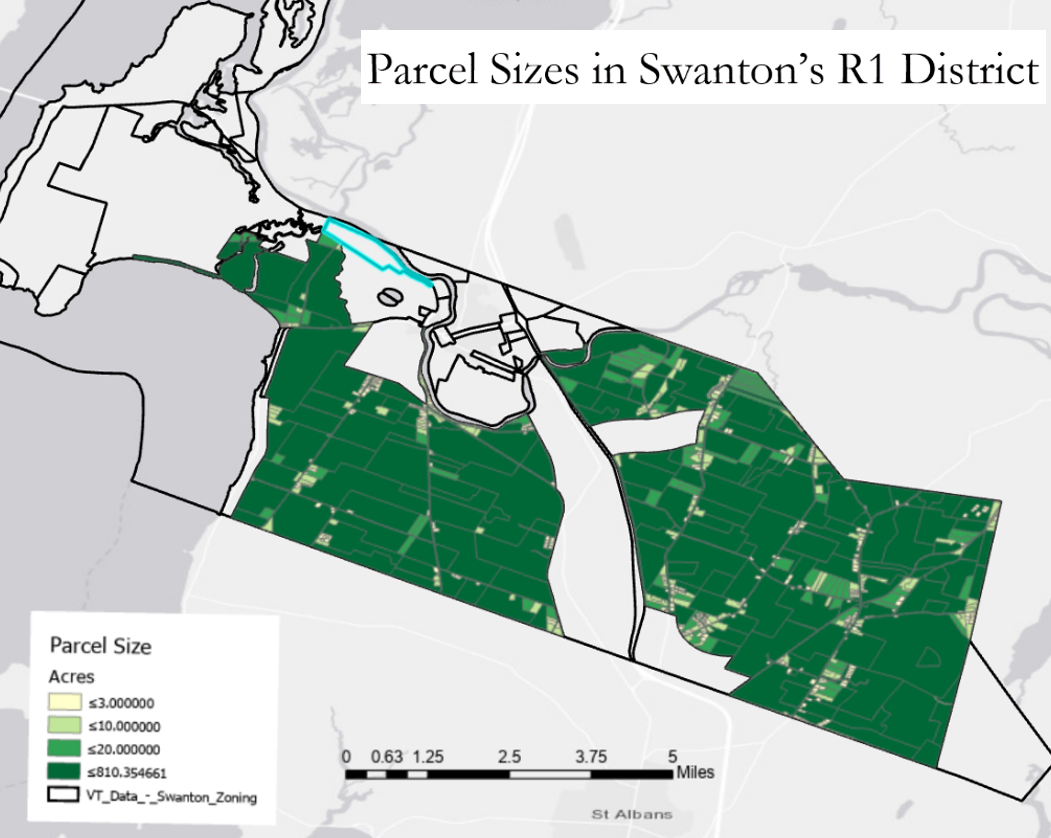
- This is an analysis of Swanton, Vermont’s zoning ordinance. The writing sample focuses on the ways Swanton can best preserve its agriculture industry through zoning, provide recreational opportunity to Swanton residence while ensuring that Swanton’s downtown village acts as its commercial, economic center.
Swanton, Vermont - Zoning Ordinance Analysis
Form Based Code Analysis
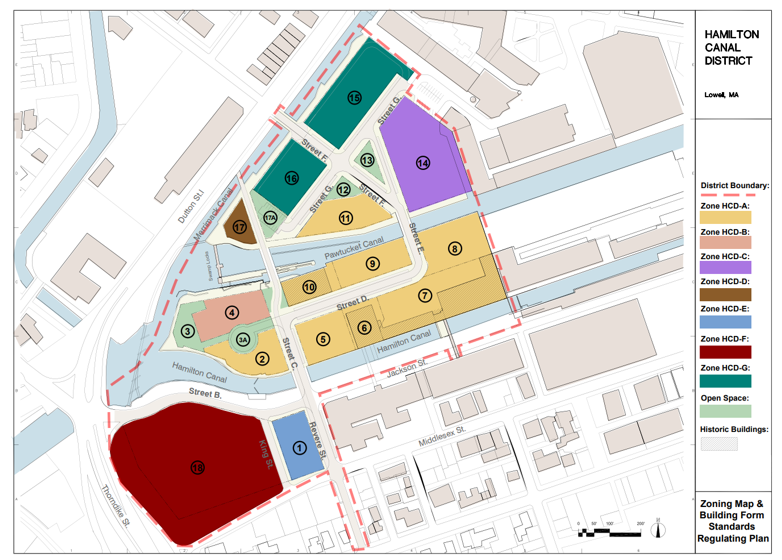
- This form-based code analysis analyzes the layout and land use functions within Lowell, Massachusetts Canal district. The writing sample focuses on the necessity to preserve Lowell’s historic resources while creating a vibrant new mixed-use commercial/ residential land use zone adjacent to Lowell’s city center.
Lowell, Massachussettes - Form Based Code Analysis
Published Research
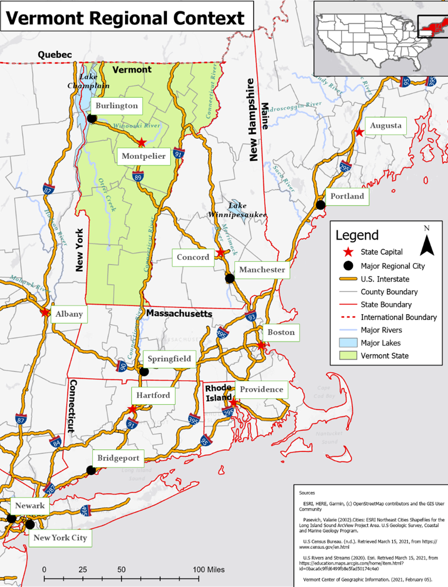
The Fragmenting Countryside and the Challenge of Retaining Agricultural Land: The Vermont Case
- This study fills the gap in the literature by analyzing the fragmentation of rural land and farmland over time in Vermont, one of the most rural states in the USA. The study seeks to: 1) identify the drivers of rural land fragmentation; 2) identify the positive and negative impacts of land fragmentation on farmers, the landscape, the local economy and to the environment); and 3) evaluate the effectiveness of policies and programs aimed at controlling the fragmentation of farmland: regulatory limits on farmland subdivision; preferential farmland property taxes; and the “preservation” of farmland through payments to farmers in return for a legally-binding agreement not to convert their farmland to non-farm uses. Took ownership of statistical calculations within studies along with the creation of all maps and figures. Facillitated in reasearch and discussion in determining driveres of rural fragmentation in Vermont and the effectivness of policies and programs controlling framland fragmentation. Paper in process of review for publication.
Vermont Countryside Fragmentation Analysis - ESRI ArcGIS, SQL, Geospatial Statistics, Cartography
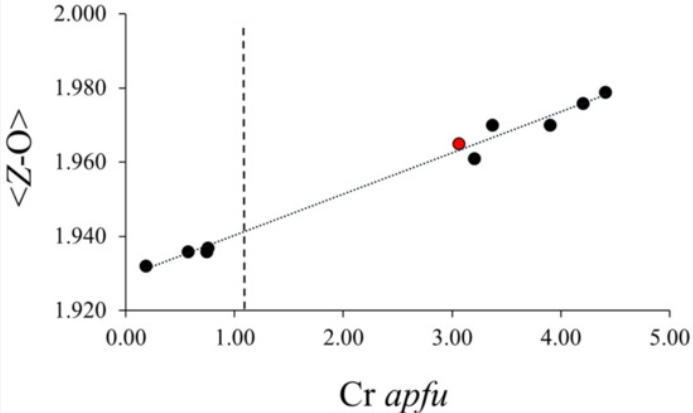
Crystal Chemistry Research
- A professional paper describing the behavior of chromium within the mineral tourmaline. An analysis of nine recently published, high-precision structures of chromium-bearing tourmaline, in combination with the Adirondack tourmaline, suggests that structural changes to the Y-site at low concentrations of Cr3+ induce changes in the Z-site that make it more amenable to incorporation of the Cr3+ substituents by increasing <Z–O>. The bond lengths change to lower the bond-valence sum of Cr3+ in the Z-site of the chromium-dravite, making that site more amenable to the substituent. Calculations suggest that the Z-site begins to accept substituent Cr3+ when the bond valence sum of that ion in Z reduces to a value of ~3.36 valence units
Geochronology Research
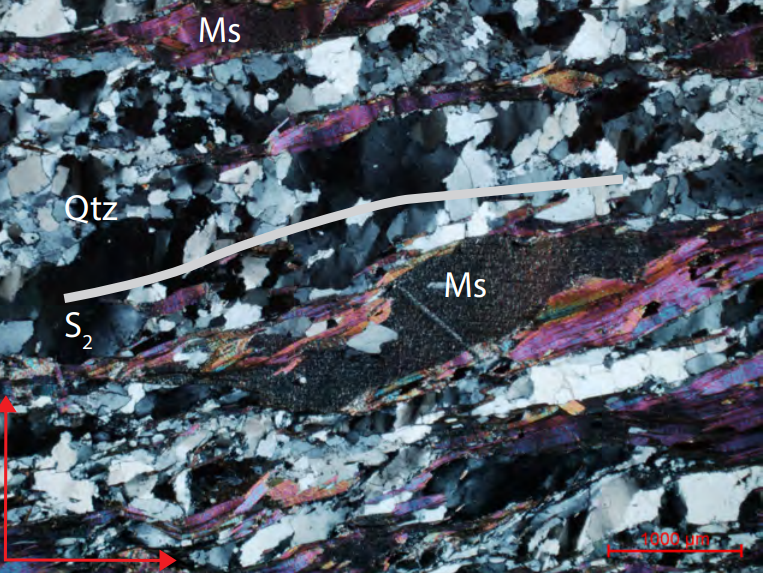
- This Geocrhonology research utilized skills in geochronology, petrology, structural geology, and geochemistry. Using these sub-geologic disciplines, we determined the timing of events within Chester Dome’s creation. The insights in this research provide geologists with a greater understanding of rock formation in the Northeast United States.
Page template forked from evanca